Building a FB Ads Dashboard with Rails
Dec 14, 2014
Working with Rails and the Facebook Ads API
The Reason For This Project
The impetus for starting this project was my repetitive annoyance of calculating and recalculating Google Analytics funnel metrics from a dashboard. I decided that it might make sense to write a Rails tool that - at the very least - could help take some of the boredom out of it. Then if this was a problem that I was coming across then maybe it could be a problem for someone else and they would give me some money for my trouble, right? It had been over a year since the last time I worked on a legit Rails project so the whole thing was going to serve as a refresher for me. I started 8-23-2014 and wrote code on weekends and weeknights. Most of it was just going over old Rails projects from the App Academy days - picking stuff up that I had forgotten like authentication. Fun stuff.
Anyway, I researched OAUTH2 and the Google Analytics API. I used as resources a pretty nice blog post Google Oauth2 and Rails that was both fairly recent and was easily understandable for me. But even when it worked and I managed to pull down the data from the API, I found it a morass and ridiculously unintuitive. The more I thought about my requirements as a User, it became clear to me that building a tool on top of Google Analytics was not going to be useful. GA is a horrible product, and I got tired of trying to make sense of all its obscure APIs.
But even as I considered setting aside this Rails project, I noticed that some of the callback and access token stuff that I had learned from the OAUTH2 struggle could be leveraged towards doing some interesting stuff with the FB Ads API. I make my living from Facebook ads. It is a booming business and I have been spending a lot of my time parsing the data and products that FB gives us. On a whim I perused the FB Ads API Documentation - especially the ad stats reading part - and realized that I could do something about it. Why not repurpose the Rails foundation, throw in some cool opensource Javascript charting software and deliver some cool charts for people?
Part 1: Figure out FB Auth
I had struggled with the Google Analytics side of the project for over 2 months before deciding to ditch it to focus on FB. No joke. I did the Git Init on 8/23 and then from there struggled on the Google API calls and authentication for the next 2.5 months - November 9, 2014.
Step 1 was authentication. This was the thing that had taken me over a month during the first step of the project. Luckily there are similiarities between the two and I think struggling through it the first time contributed to me being able to faster grasp it this time.
The way it works is this:
- Step 1: Create and register an authorized application - download the application’s ID and secret key and then throw them into Rails. For the attached Github repo I have removed the page where that data is present because secret keys are meant to be secret
- Step 2: Create a long and special URL that sends the person clicking on it to FB or Google. There is a formula to create this. You create a URL that has as one of its params a ‘callback url’. Someone clicks on the first URL and they get directed to a special FB/Google auth page, where they give their OK permission for the authorizations that I am requesting.
- Step 3: The person authorizes my app. FB then sends them back to the “callback url” that I provided in my Step 2. But when they come back to my app, they have with them a special code. I grab that in my Sessions Controller.
- Step 4: With the special code that FB/Google has given me now in my possession, I combine it together with the Application Secret Key that I got in Step 1 and then resend them back to FB/Google, asking for an access_token. If all goes well, FB sends back - finally - the access token that I need to make API calls.
The toughest part of all of this turned out to be keeping distinct steps 3 and 4. You go back and forth between FB/Google twice. Once at the beginning and then the second time to send the first code back to FB for the final access token. The other confusing thing is to make sure to keep straight your special codes. The code you get back the first time when the user comes back after authorizing your application is NOT the Auth Token you can make API calls. Don’t try it!
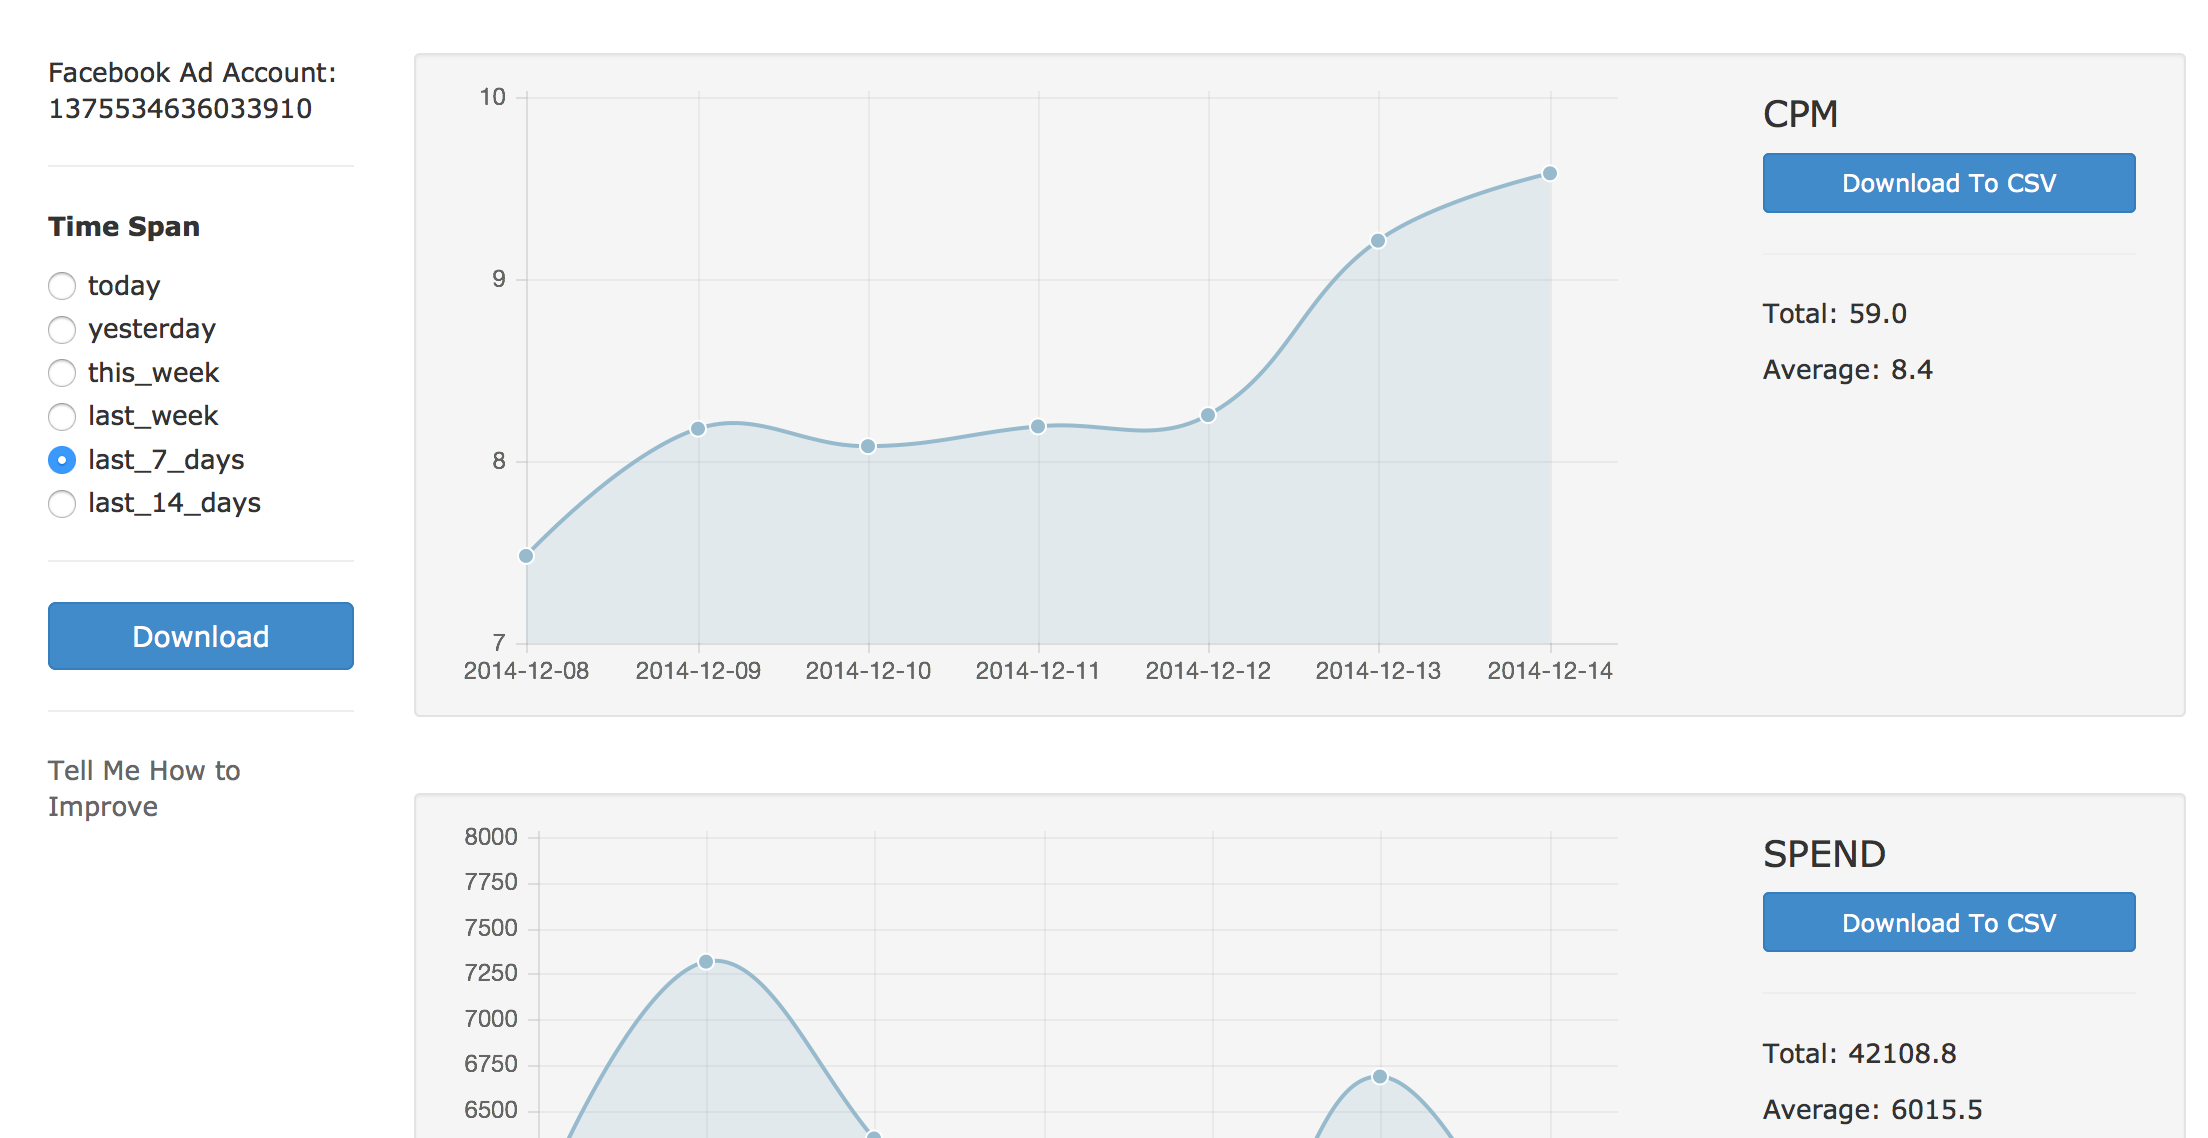
Once you get the intuitive hang of it, it’s not that hard. Using boilerplate code from my Google OAuth2 authentication module (if you go to the Sessions Controller, you can find the similarity in the code) I wrote the authentication stuff in a few hours. With the Access Token in hand, I was able to make calls to the FB Ads API and get cool statistics like Account Ad spend and Clicks in a JSON format in my browser.
Part 2: Chart the Data
Charting the data and making it all work right turned out to take much longer than I wanted. I decided between three different charting libraries. There are apparently a lot of them out there but a bunch of Google searches, it appeared that these three had the most features, users, customizations and ease of use:
- Metrics JS - Mozilla made this and it was the first one that stood out to me for all of its cool features. In my opinion this looked the coolest. The lines rendered beautifully well on a Retina Macbook screen and it meshed well with Bootstrap.
- Chartist - this had stood out to me because of two words - “simple” and “responsive”. It was also very easily customizeable and it looked really cool in a simple, flat sort of way. It did seem to have the flimsiest amount of documentation though …
- Chart.js - this popped up at the top of most Google searches. I liked how little of a footprint it had on the site as well as the prettiness of the charts. It’s vaguely responsive and the documentation felt comprehensive to me. There also seemed to me more Google help material out there.
I used and tried these frameworks one by one in my FB Dashboard. Only Chart.js ended up staying in the actual thing. What was the problem?
- MetricsJS was built on top of D3. Including D3 in the project wasn’t an issue but it did not seem to play well with the other JS that I had on my pages (especially the ones that handled forms and AJAX calls to the back-end). I tried to go backwards and just try stuff with D3 but I was never able to get it to work the way I wanted it to. It was not styled right or it never fit perfectly within the Div. Don’t even get me started with the responsive stuff either. This is the one that I spent the most time with - spending 4-6 hours of precious coffee shop time wrestling with it until I finally gave up.
- Chartist was the next one but the problem that I had with it was that first, it did not fit right size wise. The whole thing seemed off when it came to sizing. In addition, it appeared that you needed to style the whole thing yourself. It did not play well with Bootstrap either.
In the end, Chart.Js was what I went with. I was hesitant about it at first because I had spent the good part of two hours writing the JS on the Charts page just for consumption by the Metrics JS API. However, it turned out that rewriting it for Chart.js was not as bad as I thought.
Thank god this is just a small private project on my own where I can dictate what can go where. It would have driven my head through the bedboards if I was forced to just out and out make one of these charting libraries work without having the option to just tear it out and start over again.
Part 2.5: Use a Framework?
Many of the projects that I used back in App Academy were built on BackBone.js and I briefly considered using it here. I also briefly considered learning Angular.js especially since doing so would help me with the next project I want to work with (hybrid iOS/Android apps in JS).
However I felt like I was writing a very different type of app here. It is not just 1 page and it really only has 1 button and 1 callback function (it handles the charting process once the data is provided by FB). Back when I was writing RentForm, I felt like I was spending more time bending the conventions of Backbone to better adhere to what I wanted the product to do. I felt this would be the case again.
I also only am able to write product features for a long, uninterrupted span of time 1-2 times a week. I had spent two such weekends wrestling with Swift as I tried to build a little Hackernews app. The time was totally wasted and I felt very sad at having such little accomplished. Perhaps in the future there would be time for me to go for it - or there would come a time when the product is so ridiculously complex that I would be forced to do it anyway - but that time has not yet come. For now I am writing individual functions as I come to need them.
Part 3: CSV Download and Other Minor Features
CSV download is probably what I am most excited about even though it took the least time - and 1 Google search - to code. I basically Googled “write csv javascript” and clicked on the first thing that I came across. The code that I got out of the search result became the following.
this.downloadToCSV = function (key) {
  		var csvContent = 'data:text/csv;charset=utf-8,'
  		var dataToDownload = new Array()

  dataToDownload[0] = this.returnChartJSArray('date_start')
  dataToDownload[1] = this.returnChartJSArray(key)

  csvContent += "date," + key + '\n'

  dataToDownload[0].forEach(function (csvArray, index) {
    dataString = dataToDownload[0][index] + ',' + dataToDownload[1][index]
    csvContent += dataString + '\n';
  })

  var encodedURI = encodeURI(csvContent)
  window.open(encodedURI)
}
The code is pretty simple to understand here. I had written a function that parses the FB data response and comes out with a simple array of values (the “y” values for the chart). I use that same function to generate the “x” values for the chart and together it writes the CSV almost like the printer (it felt good to add the ‘\n’ at the end like the little DING when the printer moves back to the 0 position). Then with a nifty little “window.open” I can get a CSV download! Omg that’s so awesome.
If you have read my previous article, you’d have noticed that I have a thing for CSVs and Excel stuffs. Can’t explain it. Must be the old finance guy in me.
Next …
I am going to continue hacking away at this thing. While the charting stuff was pretty interesting and there were other ways that I could go with it (perhaps write the JS so that it susses out the Offsite Actions and then charts those as well?) but I decided to dive deeper into the ads structure. The next thing to do is to see if I can rebuild Power Editor itself! Haha, just kidding I am not that crazy but breaking out some of its functions would be cool. I will write about it if there is anything I am particularly interested to share with you.
The project is live on Heroku as https://niner.herokuapp.com. The Heroku version lives in Github at https://github.com/jonathanstyu/facebook-ad-data-charts. Check it out and let me know what you think.
Share